The Challenge
Creating an animated bar graph to depict the concept of decrease.
The Backstory
“When tax rates decrease”, this was a line I wrote while penning the narration script for a demo course on inflation. While designing a visual for the aforesaid line, I thought of showing a vertical bar – the bar was to be labelled ‘Income Tax Rate’ – that will shrink in height as the sentence was being narrated.
Now to show an image/object moving in Articulate Storyline, the ‘Motion Path’ is one’s go-to animation effect. Using this effect, one can move an object/image along a specified path. And therein laid the challenge: When I applied this effect, the entire bar moved down. However, the bar that I wanted needed to have a downward-moving upper half and a stationary lower half. Thinking along this line – a downward-moving upper half and a stationary lower half – led me to the solution. The Solution
First I created two vertical rectangles and placed them on top of each other.Tip: I removed the outline to create the illusion of a single rectangle.
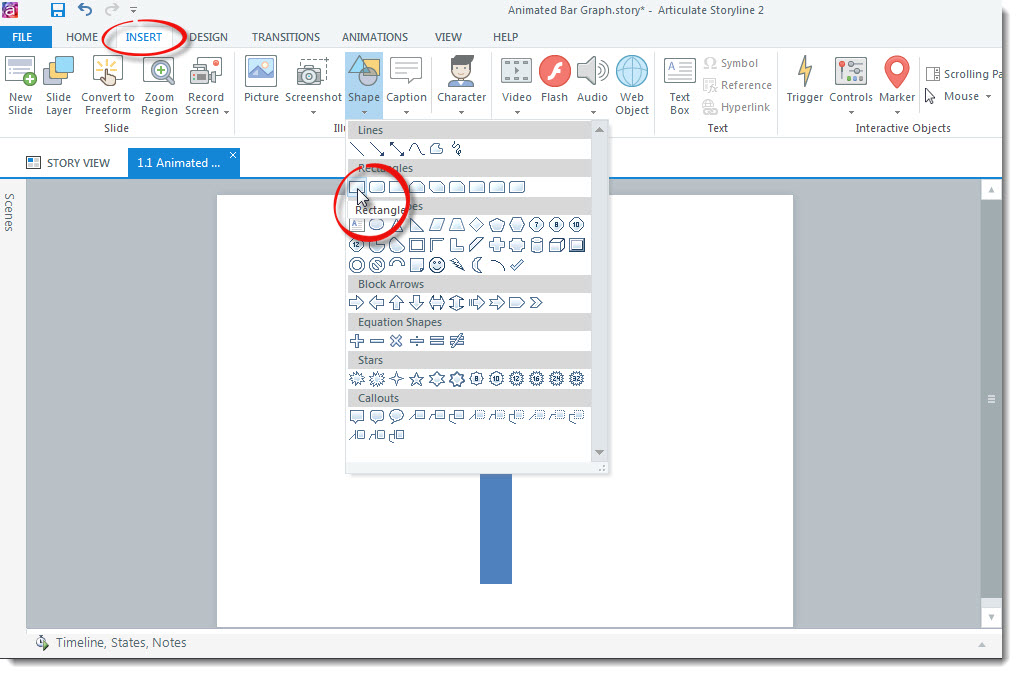
Creating a Rectangle in Articulate Storyline
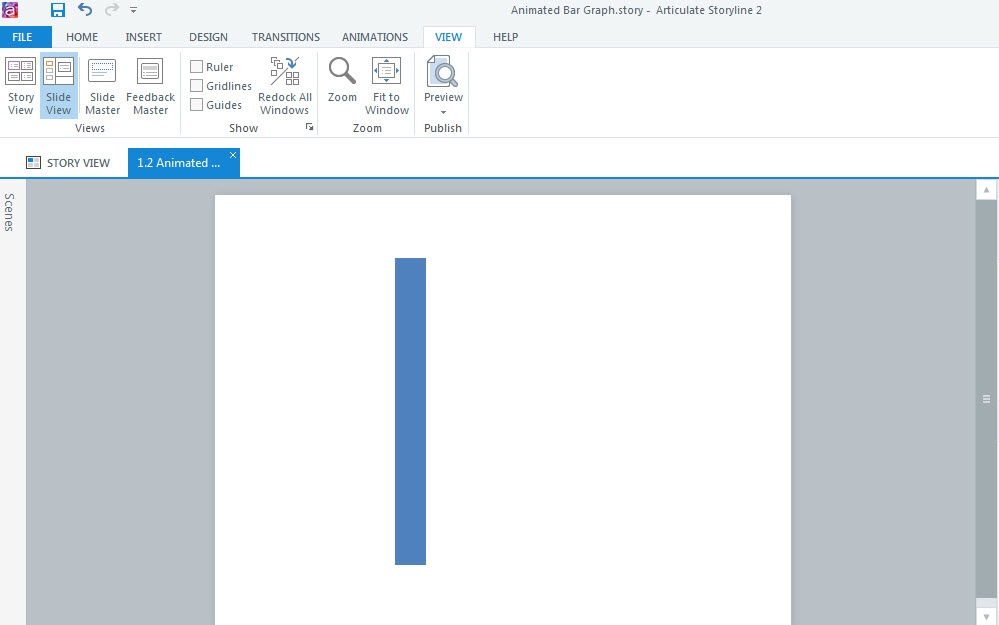
Two Rectangles Placed on Top of Each Other
Next, I applied the ‘Motion Path’ animation effect to the upper rectangle.
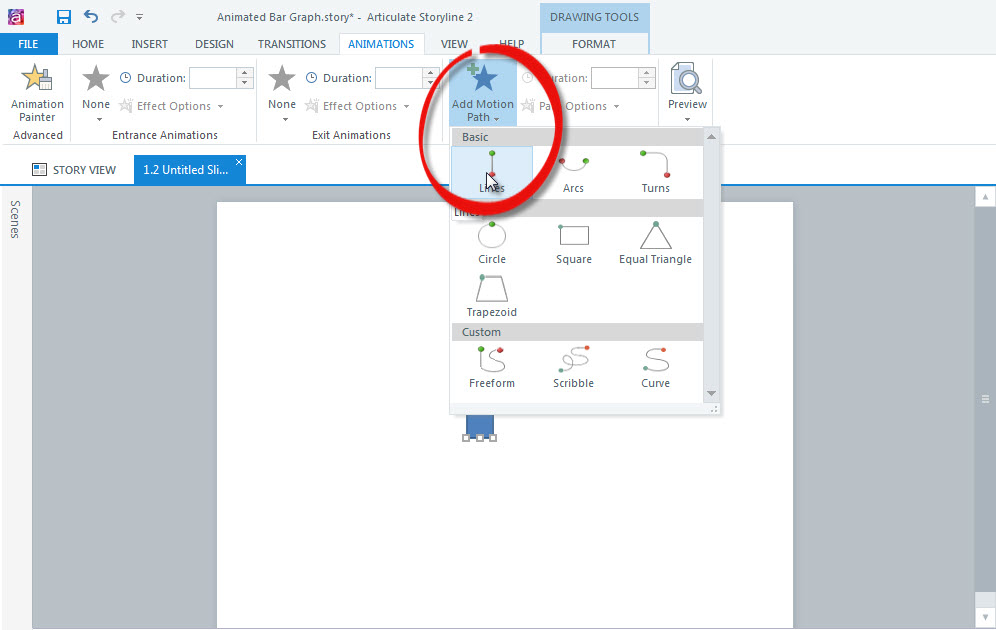
Applying the Motion Path animation effect in Articulate Storyline
Thereafter, I adjusted the end point (represented by a red circle) of the motion path to ensure that the upper rectangle does not slides down below the lower rectangle once the animation gets over. Had I not adjusted the end point, the upper rectangle would have slid below the lower rectangle, and the effect of a bar decreasing in height would not have got created.
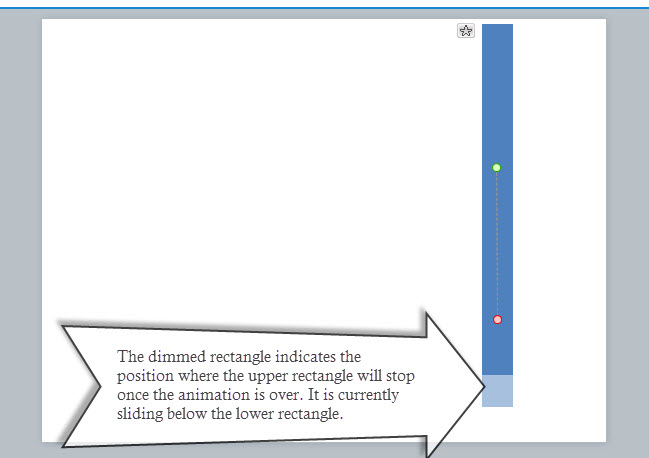
Motion Path of the Uppper Rectangle before Adjustment of the End Point
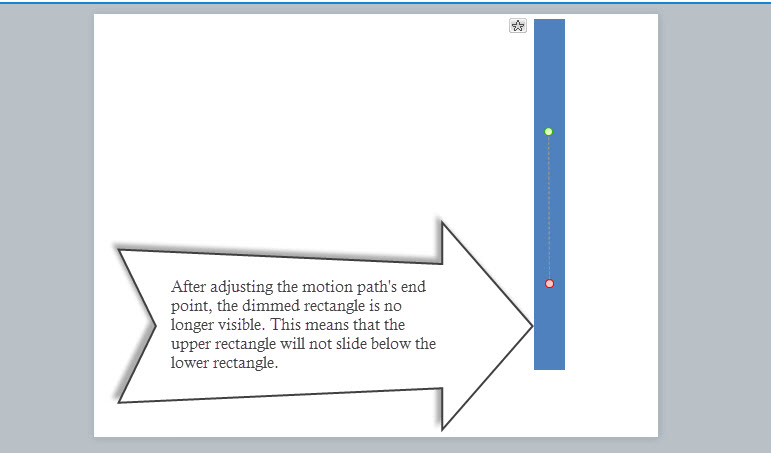
Motion Path of the Upper Rectangle after Adjustment of the End Point
This is how I created an animated bar graph in Articulate Storyline.
Head to the Templates page of the Free Zone section to view the animation or to download the Articulate Storyline file. You can also download the tutorial, which explains the entire process step by step.
1 Comment
|
 RSS Feed
